


Print this Topic
Overview
This topic is intended to provide an overview of the Aerotrac Reliability Module.
Topic Contents
Exporting Data to Microsoft Excel
Create Total Flying Hours Graph
Unscheduled Component Removal by ATA
In order for the aircraft details to appear in the Reliability Module, the aircraft needs to be set as "Subject To Reliability".
In the Administrator Module, navigate to Administrative Setup, Aircraft Management, A/C Management, Fleet Details and go to the "Management" tab :-

To enter new or edit existing Defect Codes, in the Administrator Module, navigate to Administrative Setup, Quality, Defect Codes :-

Defect Codes are flagged as either PIREP (Pilot reported) or MAREP (Maintenance reported), or both and are assigned to the relevant aircraft Product Group.
Once set up, Defect Codes are applied to :-
1) Pilot Reported Defects, to aid Defect Reporting, when the Defect is initiated from the Aerotrac Utilization screen (Tech Log / Sector Record Page)
2) Unscheduled Maintenance Tasks, to aid Defect Reporting, when the Tasks are added to either the Hangar Project Technical Details, via the Inspection Workbench or the Maintenance Update.
Delay Codes, Classes and Delay Severity
The setup for the various Delay features is found in the Administrator module under Administrative Setup, Aircraft Management, A/C Management :-
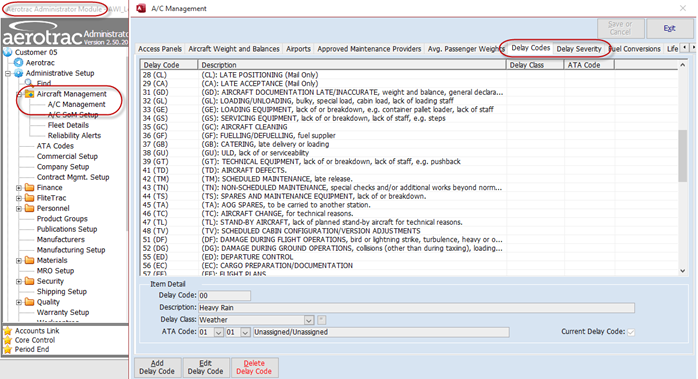
Some default Delay Severity times would have been entered into the database previously, but others can be added or existing times edited :-

Prior to adding Delay Codes, it is necessary to add in some Delay Classes. This is achieved via the "*" button on the Delay Codes tab (while in Add or Edit mode) :-
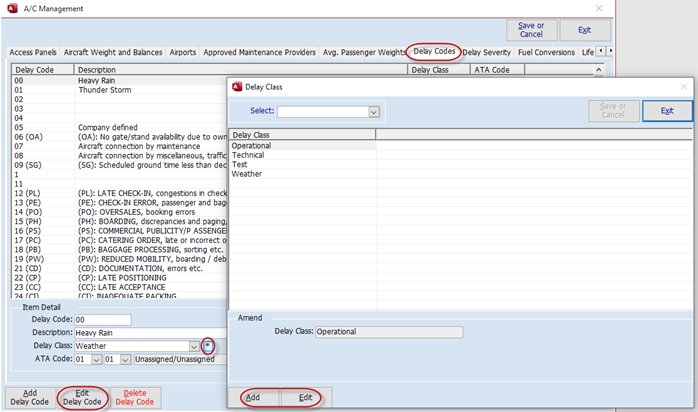
Delay Codes are then added, and the relevant Class applied :-

Once set up, Delay Codes are entered via the Aircraft Utilization screen. See the section on Delays later in this topic.
To enter new or edit existing Fault Codes, in the Administrator Module, navigate to Administrative Setup, Quality, Quality Setup :-

Once set up, Fault Codes are, amongst other things, applied to Component Removals (when carried out via the Inspection Workbench) :-

There are two areas that are required to be set up for Reliability Alerts.
The first is the warning when a set number of component removals is exceeded (based on ATA level 1 and level 2)
The second is when the set uplift levels are exceeded.
In the Aerotrac Administration Module, navigate to Administrative Setup, Aircraft Management, Reliability Alerts.
Select the relevant Aircraft Product Group :-
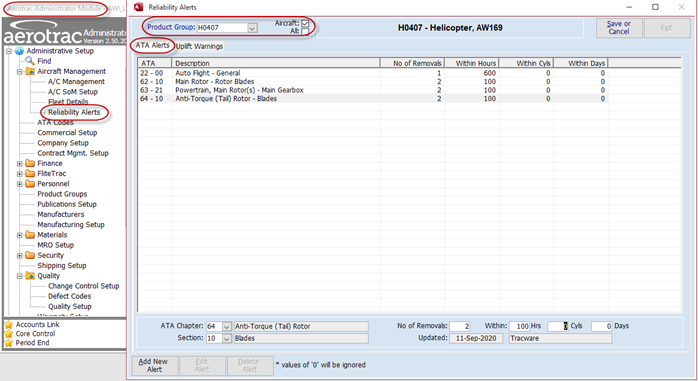
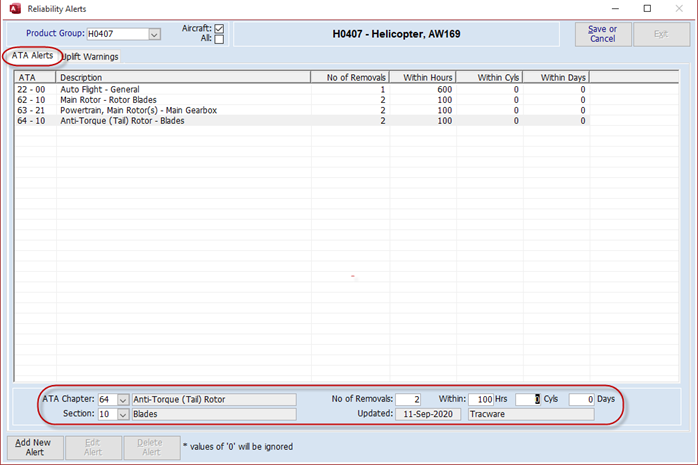
On the "ATA Alerts" tab edit and set the relevant criteria by ATA Codes levels 1 and 2 :-
On the "Uplift Warnings" tab you can set warnings for the aircraft related uplifts and for Engine Oil uplifts. The default setting is for Aircraft Product Groups :-

Note: The Misc 1 , 2 and 3 fields can be user defined for other Uplifts. The fields labels can be set in System Options.
In order to set Engine Oil uplifts, it is necessary to tick the "All" tick box so that Engine Product Groups appear for selection :-

Once setup correctly, the Reliability module screen collects the relevant data, associated with reliability of the aircraft and components, from other areas of the Aerotrac system.
The Reliability Management Module is accessed from Aerotrac via the main menu under Aircraft Management :-
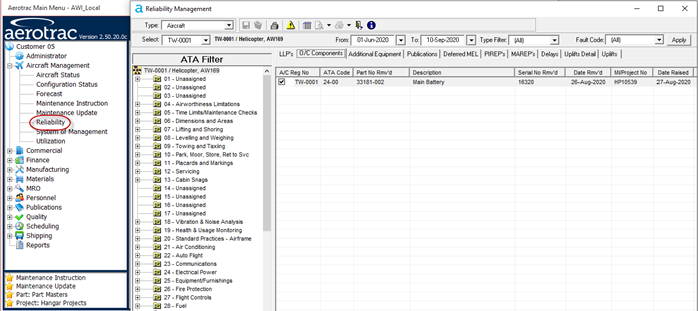
The data, associated with reliability of the aircraft and components, collected from various areas of Aerotrac is displayed on the Reliability Management screen.
This screen is view only and allows you to review and filter the data, as necessary, and to export to Microsoft Excel. See the section later in this topic on Exporting Data to Microsoft Excel.
To populate the screen, select the relevant search criteria and click the "Apply” button :-
This section covers the various data filters that are available.
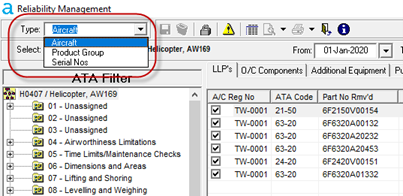
The "Type" filter allows you to filter the displayed data by :-
- A particular aircraft, by tail number
- Aircraft Product Group
- Component Serial Number
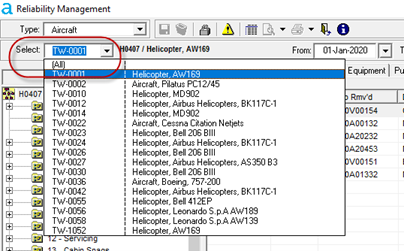
Subject to the selection made above, the "Select" filter then displays the relevant aircraft registrations, Product Groups or Component Serial Numbers :-
Data can also be filtered by level 1 ATA Code by clicking the relevant ATA code in the list in the left-hand pane :-

To remove the ATA filtering, click on the aircraft line at the very top of the list :-

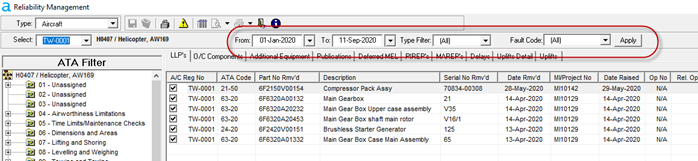
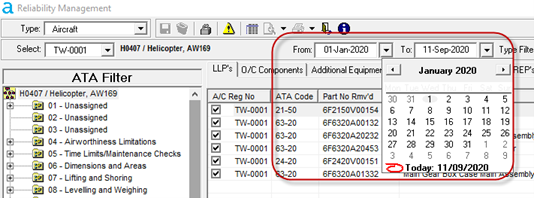
Data can also be filtered by date. By default, the "From" filter will be empty and the "To" filter populated with today's date. This will return all relevant data unless otherwise filtered :-
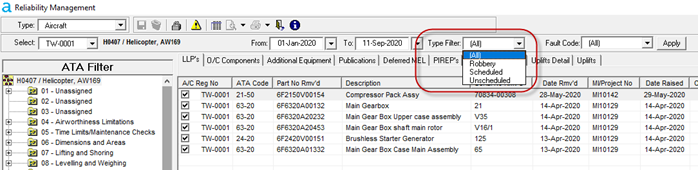
The "Type" filter, as displayed below, relates only to components removed and allows filtering subject to whether the component was removed as Scheduled (via the Aircraft Status in a Project or Maintenance Instruction), Unscheduled (via the Inspection Workbench) or as a Robbery (also via the Inspection Workbench) :-
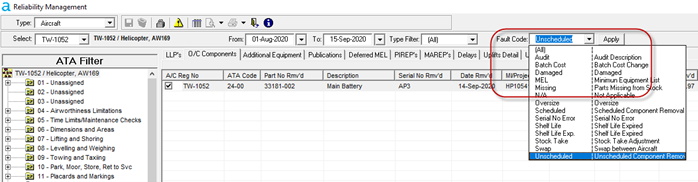
The "Fault Code" filter (this only appears on certain tabs) allows selection of those Fault Codes applied when a particular Component was removed :-
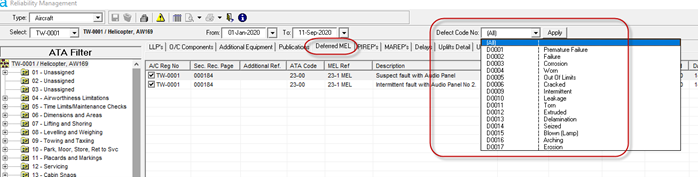
The "Defect Code" filter, (this only appears on certain tabs) allows selection of those Defect Codes as applied to Pilot Reported Defects (added via the Aircraft Utilization) or when applied to Unscheduled Tasks entered via the Hangar Project Technical Details screen, via the Project Inspection Workbench or via the Maintenance Update :-
While most of the icons used are fairly standard the following may require some explanation :-
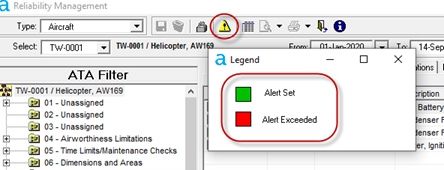
- The Alerts Legend :-
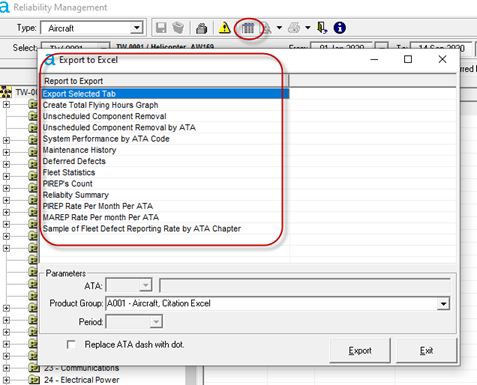
- The Export to Excel feature :-
- Closing the Reliability Module :-
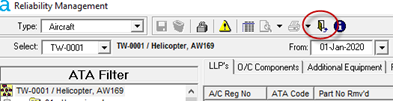
- Viewing the Reliability Module Version:-

The collected data can also be sorted within the columns by clicking on the relevant column headers :-
The following sections cover the various tabs that display the data and the theory behind why certain data is displayed.
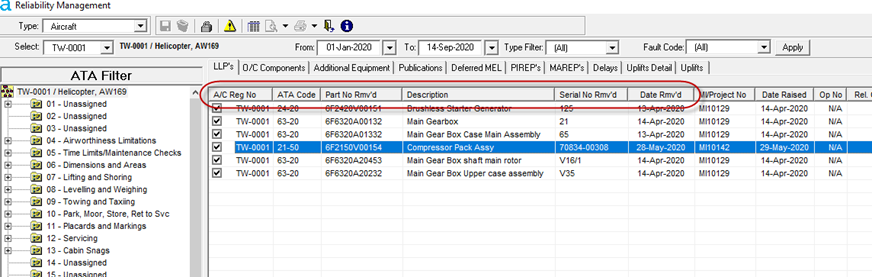
This tab displays the data for managed aircraft Configuration Life Limited components, that have been removed from the aircraft via a Hangar Project or Maintenance Update for some reason and subsequently replaced.
The component removals are categorized by Scheduled, Unscheduled and Robberies :-
1. Scheduled - This is where the removal is initiated from the Hangar Project or Maintenance Instruction and via the Aircraft Status (Tech Records function) irrespective of whether the removal is then confirmed via Project Updates or via the Inspection Workbench.
2. Unscheduled - This is where the removal is initiated from the Project Inspection Workbench (Engineering function)
3. Robberies - This is where the removal is initiated from the Project Inspection Workbench (Engineering function) and flagged as a Robbery.
An alert will display against a Component subject to the setup (refer to the section on “Reliability Alerts” earlier in this topic) and how many times a Component in the relevant ATA Code has been subject to removal in the given Hours / Cycles / Days :-
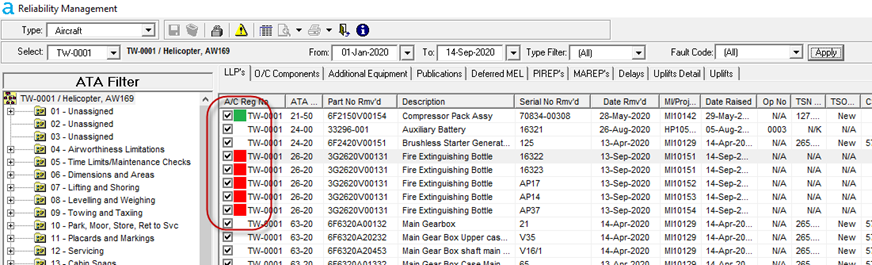
Green denotes that an alert has been set. Red denotes that a set alert has been exceeded.
Where the "Hours Flown" and "Cycles Flown" fields have the values in blue font, this denotes that the values are calculated based on Airframe Hours / Cycles. These are generally where the component has no life details of its own (mainly calendar related items). If you hover over these fields, a tool tip is also displayed that explains the blue font.
This tab displays the data for managed aircraft Configuration "On Condition" components, that have been removed from the aircraft via a Hangar Project or Maintenance Update for some reason, and subsequently replaced.
These component removals are also categorized by Scheduled, Unscheduled and Robberies in the same manner as the LLPs above
This tab displays the data for managed aircraft Configuration AEL components, that have been removed from the aircraft via a Hangar Project or Maintenance Update for some reason, and subsequently replaced.
These component removals are also categorized by Scheduled, Unscheduled and Robberies in the same manner as the LLPs and On Condition Components above.
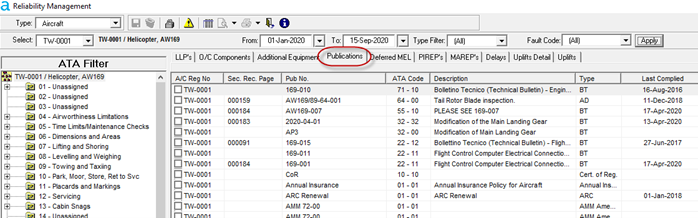
This tab displays the data for all Publications imported into the relevant Aircraft Status subject to the filtering in place :-
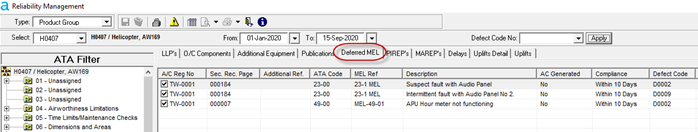
This tab displays the data for Pilot reported Defects, as initiated from the Aircraft Utilization screen, that have MEL implications :-
For them to appear as PIREPS, the PIREP Defect code needs to be applied at the point of entry on to the Aircraft Status "Defect" tab. The process is :-
- Add Utilization entry, in the usual manner, for Aircraft and Engine detail etc.
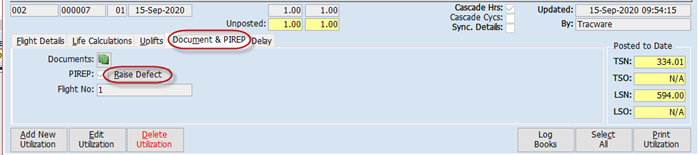
- Flag as Pilot Reported Defect (PIREP) :-
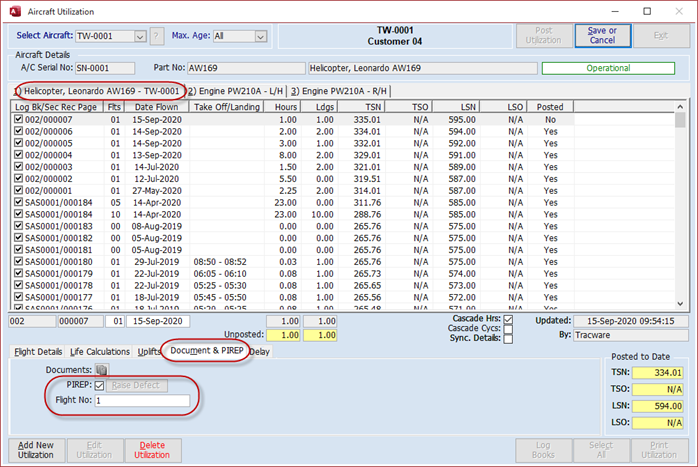
- Save the record and "Raise Defect" via this button :-
- Defect details are added to Aircraft Status and the relevant Defect Code is applied :-

- It is at this stage that the link is made to the pre-defined MEL Task Card :-
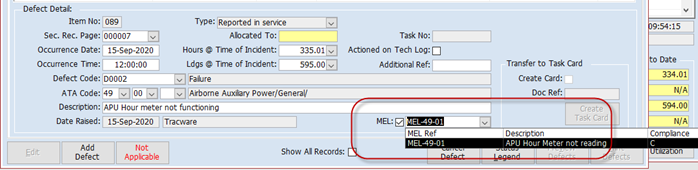
- The MEL Task Card is then imported into the Aircraft Status in the usual manner.
Refer to the topic "Defects and MEL” for further details on this.
This tab displays the data for Pilot reported Defects, as initiated from the Aircraft Utilization screen, that do not have MEL implications.
The defect is added to the system and set up in the same manner as per “Deferred MEL” section above.
The only difference to the above section is that here the Defect is not linked to a MEL Task.
This tab displays the data for Unscheduled Maintenance Tasks added to the Hangar Project, either via the Inspection Workbench or via the Technical Details screen, or entered on a Maintenance Instruction Update :-
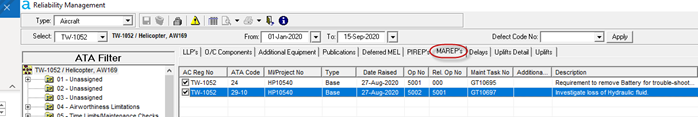
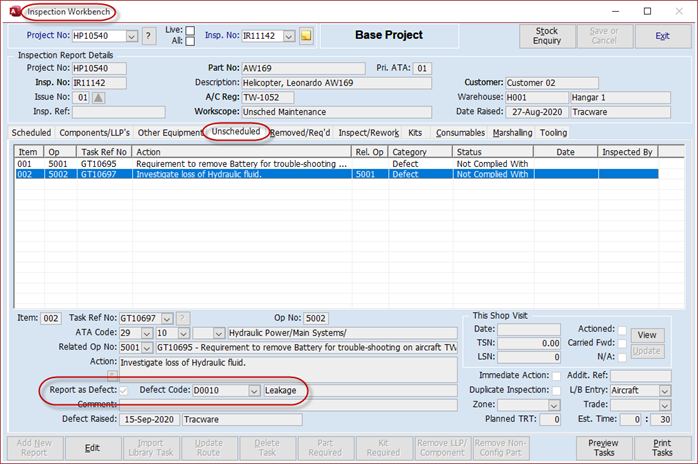
For them to appear as MAREPS the Tasks need to be flagged as "Report as Defect" and a “Defect Code” selected when they are added to the Hangar Project Inspection Workbench :-
Flagged as a "Defect" and a “Reportable Defect Code” selected when entered via the Hangar Project Technical Details screen :-

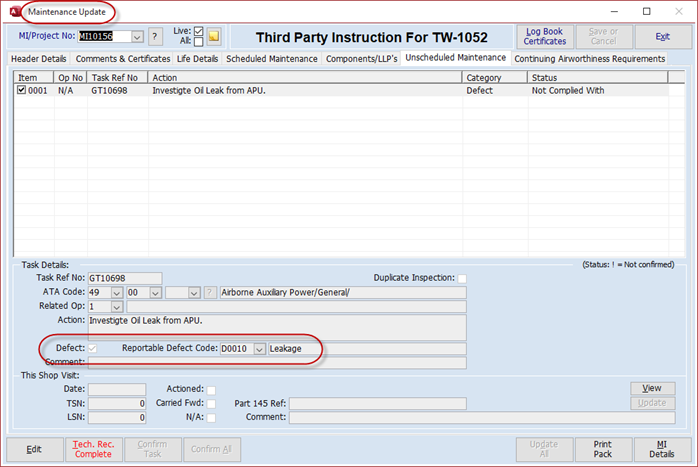
Or flagged as a "Defect" and a “Reportable Defect Code” selected when entered via a Maintenance Instruction Update :-
Double-clicking on a line on the MAREP screen will open a pop-up that gives more detail on the Unscheduled Task.
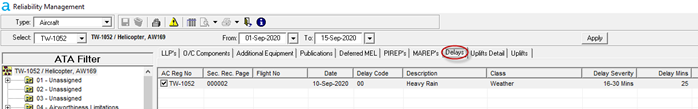
This tab displays the data for Delays as entered via the Aircraft Utilization screen :-

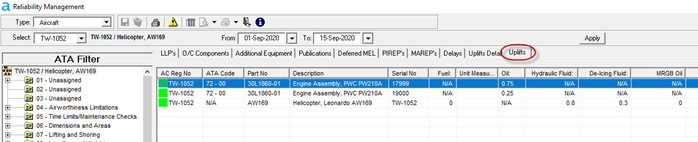
This tab displays the data from each sector record page, added into Aerotrac via the Utilization screen, that has had uplifts of some kind entered :-

This tab summarizes the uplifts against each Aircraft / Engine as per the details added via each Aircraft Utilization detailed above :-
An alert will display subject to the setup (see section above on Reliability Alerts) and the quantities added as Uplifts.
Green denotes that an alert has been set. Red denotes that a set alert has been exceeded.
Exporting Data to Microsoft Excel
The Reliability Management screen allows the collected data to be exported to Microsoft Excel for further filtering and sorting etc. You can then also publish the results as you wish.
There are several export options explained in the following sections.
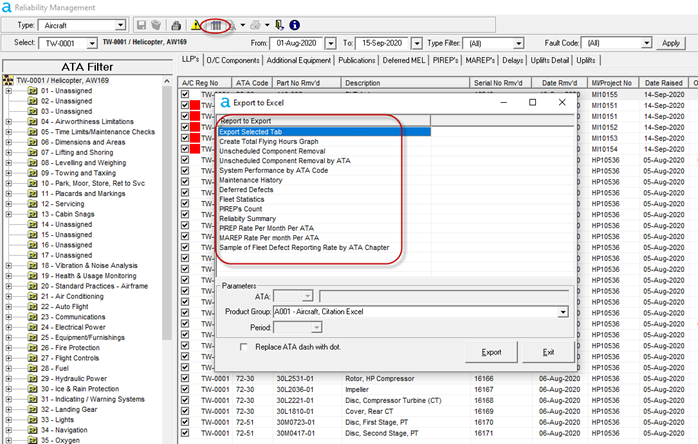
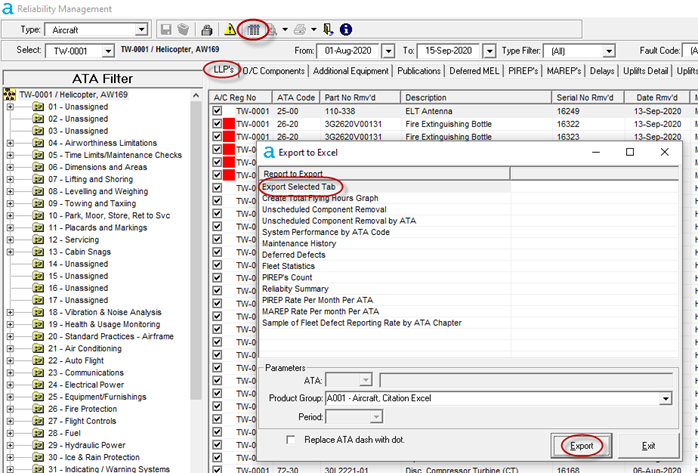
Use the relevant filters to produce the required data on the specific tab of interest and launch the reports feature via the button on the top menu line.
In the export screen that opens, select the top “Export Selected Tab” line and click the “Export” button :-
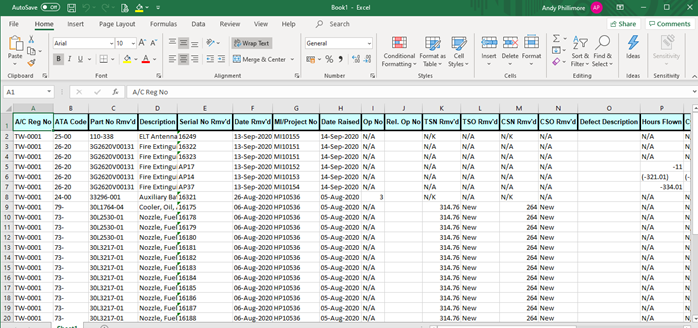
The system will open an Excel spread sheet and populate it with the data from the selected tab.
Note: The spread sheet file will be minimized on the task bar and will need to be maximized in order to view.
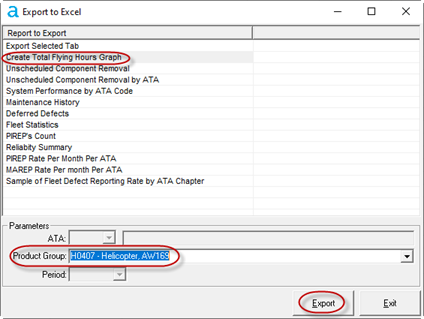
Create Total Flying Hours Graph
The Flying Hours graph is based on aircraft type and as such you need to select the Aircraft Product Group in order to generate the graph :-
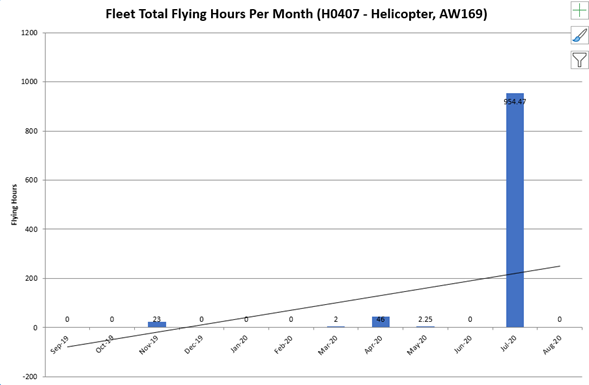
The system then opens an Excel spread sheet and populates it with a graph of flying hours for that aircraft type based on the previous 12 completed months :-
The Unscheduled Component Removal report is based on aircraft type and as such you need to select the Aircraft Product Group in order to generate the report :-

The system then opens an Excel spread sheet and populates it with a table of the unscheduled component removals for the selected aircraft type based on the previous 12 completed months :-
Unscheduled Component Removal by ATA
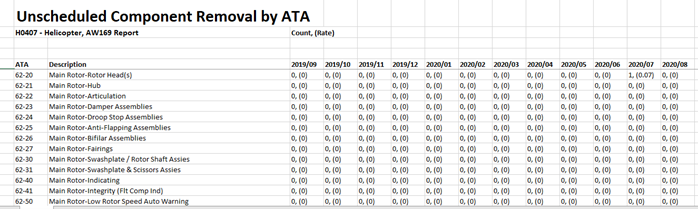
The Unscheduled Component Removal by ATA report is based on aircraft type and as such you need to select the Aircraft Product Group in order to generate the report.
You can leave the ATA filter empty to report on all ATA codes or use the filter to report on just one code :-

System Performance by ATA Code
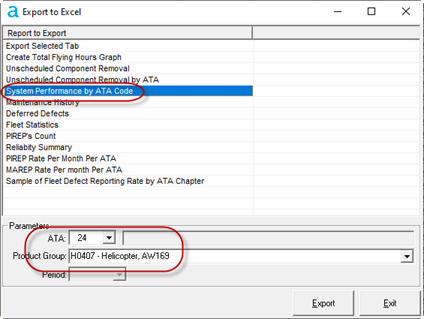
The System Performance by ATA Code report is based on aircraft type and as such you need to select the Aircraft Product Group in order to generate the report, along with the required ATA Code :-
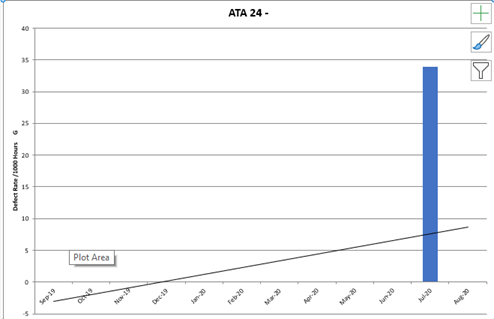
The system then opens an Excel spread sheet and populates it with a graph of the defect rate, for the selected ATA and aircraft type based on the previous 12 completed months :-
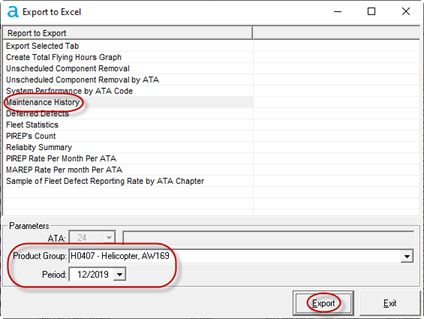
The Maintenance History report is based on aircraft type and as such you need to select the Aircraft Product Group. You will also need to select a period in order to generate the report :-
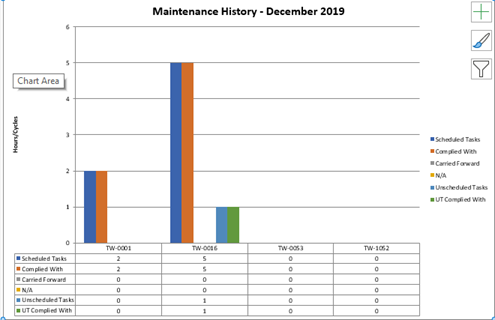
The system then opens an Excel spread sheet and populates it with a graph of the maintenance history, scheduled and unscheduled tasks, for the selected aircraft type and period :-
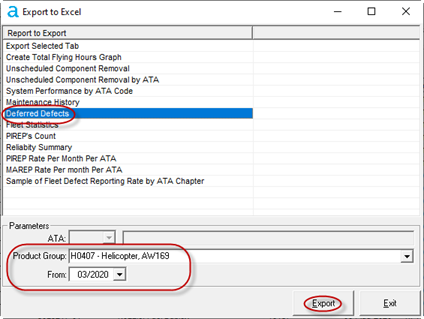
The Deferred defects report is based on aircraft type and as such you need to select the Aircraft Product Group in order to generate the report, along with the period that you wish to report from :-
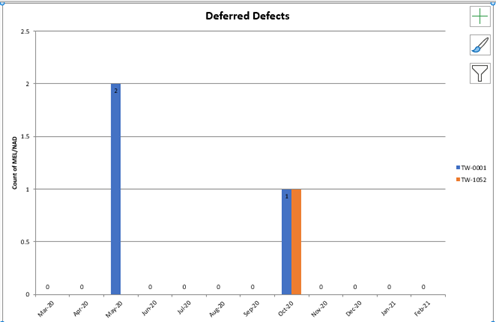
The system then opens an Excel spread sheet and populates it with a graph of the deferred defects, for the selected aircraft type from the selected period and the subsequent 11 months :-
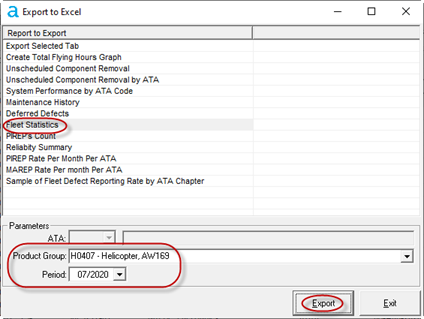
The Fleet Statistics report is based on aircraft type and as such you need to select the Aircraft Product Group in order to generate the report, along with the required period :-
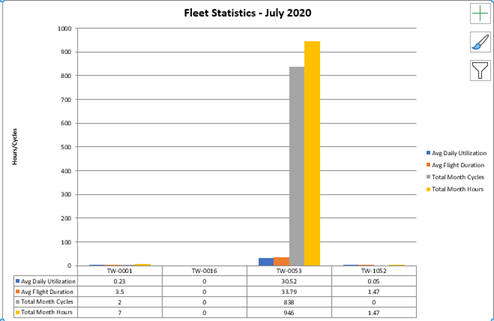
The system then opens an Excel spread sheet and populates it with a graph of the total and daily average Utilization figures for the selected aircraft type and month :-
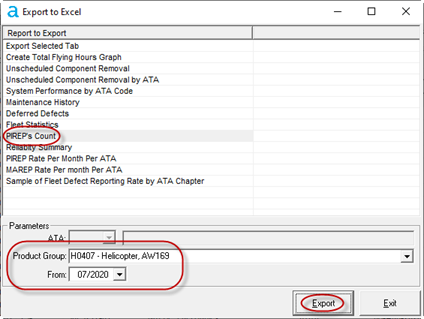
The PIREPS Count report is based on aircraft type and as such you need to select the Aircraft Product Group in order to generate the report, along with the period that you wish to report from :-
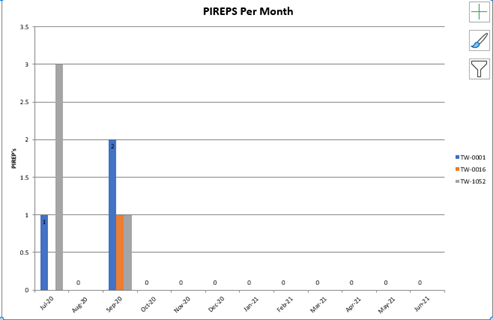
The system then opens an Excel spread sheet and populates it with a graph of the PIREPS per month, by aircraft tail number, for the selected aircraft type from the selected period and the subsequent 11 months :-
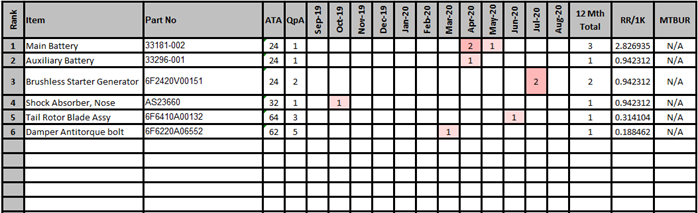
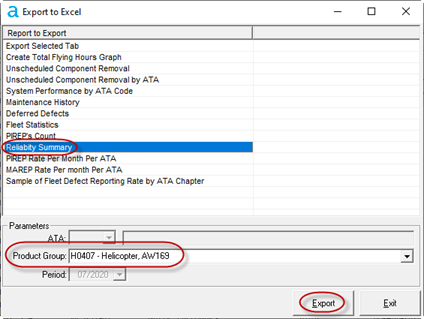
The Reliability Summary report is based on aircraft type and as such you need to select the Aircraft Product Group in order to generate the report :-
The system then opens an Excel spread sheet and populates it with a table displaying a summary of reliability data for the selected aircraft type based on the previous 12 completed months :-

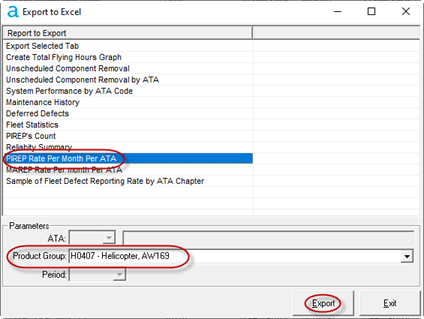
The PIREP Rate Per Month Per ATA report is based on aircraft type and as such you need to select the Aircraft Product Group in order to generate the report :-
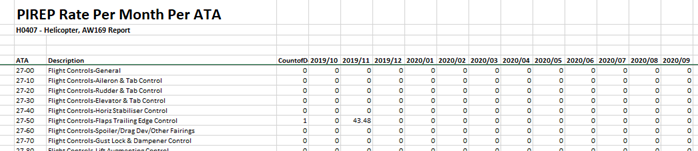
The system then opens an Excel spread sheet and populates it with the PIREP rate data for the selected aircraft type based on the previous 12 completed months :-
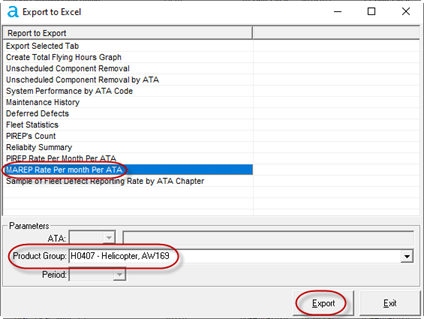
The MAREP Rate Per Month Per ATA report is based on aircraft type and as such you need to select the Aircraft Product Group in order to generate the report :-
The system then opens an Excel spread sheet and populates it with the MAREP rate data for the selected aircraft type based on the previous 12 completed months :-

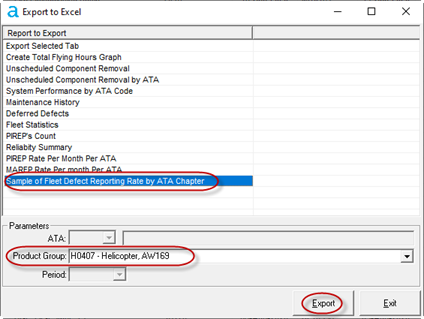
Sample of Fleet Defect Reporting Rate by ATA Chapter
The Sample of Fleet Defect Reporting Rate by ATA Chapter report is based on aircraft type and as such you need to select the Aircraft Product Group in order to generate the report :-
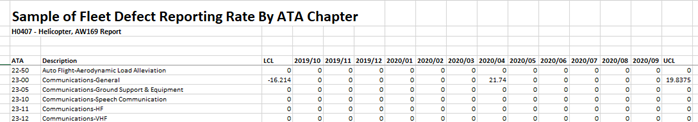
The system then opens an Excel spread sheet and populates it with the Defect Reporting Rate data by ATA for the selected aircraft type based on the previous 12 completed months :-
Aerotrac Version v2.50.20.01, November 2020
Not controlled once printed
END